Infographic:
A visual image such as a chart or diagram used to represent information or data
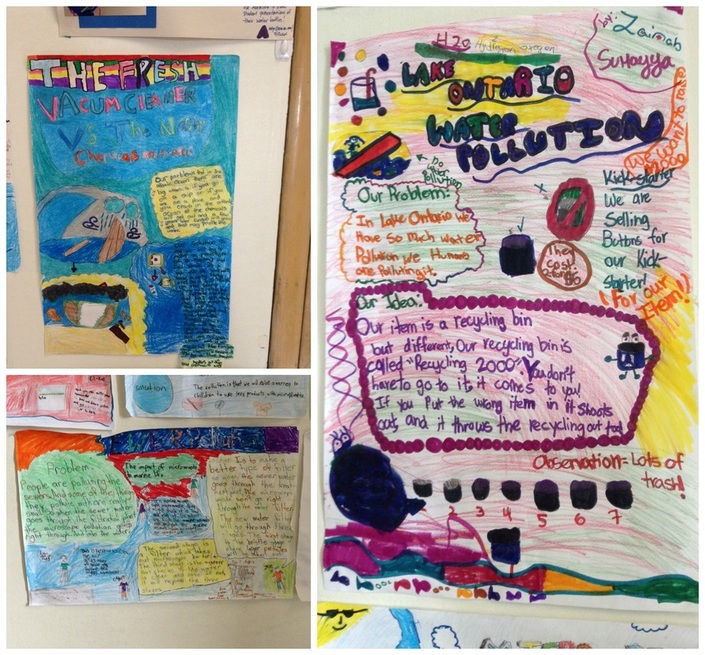
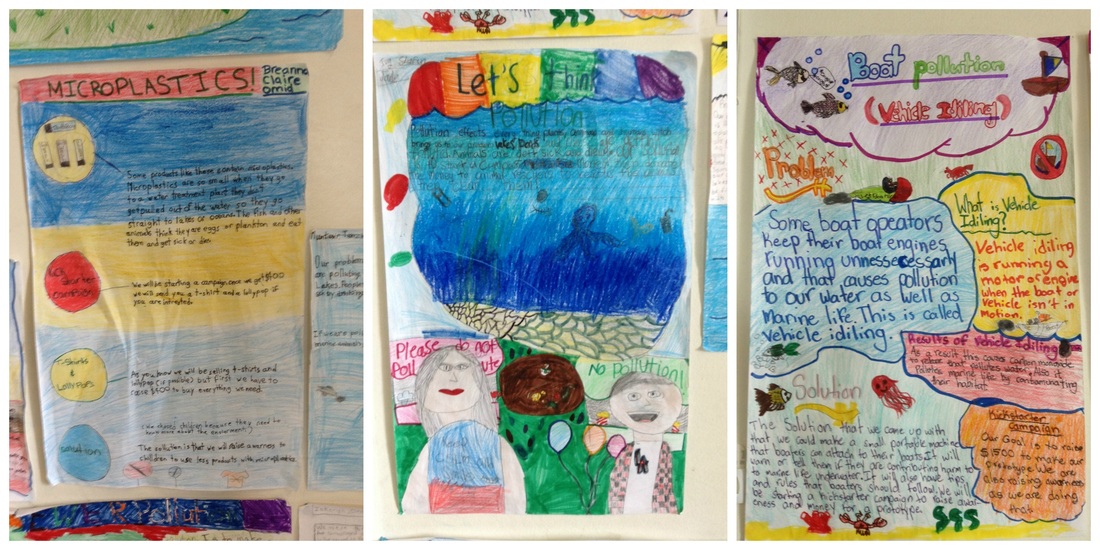
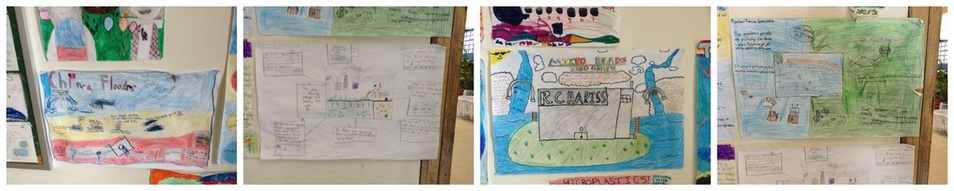
The students were given the challenge to create an infographic to share their solutions. While some believed that these would be their final solutions, already a number of groups have pivoted and their solutions are completely different.
Interested in our solutions? Check out our blog page and view the post on March 10, 2015: SOLICITING FEEDBACK FROM OUR PEERS!
We're always looking for feedback so feel free to share your thoughts with us.
Interested in our solutions? Check out our blog page and view the post on March 10, 2015: SOLICITING FEEDBACK FROM OUR PEERS!
We're always looking for feedback so feel free to share your thoughts with us.